本代码提供了matlab下求取经过霍夫变换的直线斜率,并将其联合,代码见下方,实验结果见文末。
- %入口图像为BW,出口图像为f
- %optimizefrommain_optimize,merelyselect2lines,onehaspositive
- %slope,theotherhasnegativeslope
- clearall,closeall
- BW=imread('D:ImagesNEWimg4b9faef664e03.jpg');
- figure,imshow(BW);
- BW=rgb2gray(BW);
- %thresh=[0.01,0.17];
- thresh=[0.01,0.10];
- sigma=2;%定义高斯参数
- f=edge(double(BW),'canny',thresh,sigma);
- figure,subplot(121);
- imshow(f,[]);
- title('cannyEdgeDetectResult');
- [H,theta,rho]=hough(f,0.1);%cos(theta)*x+sin(theta)*y=rho
- %imshow(theta,rho,H,[],'notruesize'),axison,axisnormal
- %xlabel('theta'),ylabel('rho');
- [r,c]=houghpeaks(H,10);
- holdon
- lines=houghlines(f,theta,rho,r,c);
- subplot(122);
- imshow(f,[]),title('HoughTransformDetectResult'),holdon
- nlind=0;%newlineindex
- st=1;
- %%%%%%%%%求斜率%%%%%%%%%%%%
- fork=1:length(lines)
- %xy=[lines(k).point1;lines(k).point2];
- xielv(k)=(lines(k).point2(1)-lines(k).point1(1))/(lines(k).point2(2)-lines(k).point1(2)+0.0001)
- end
- %%%%%%%%%将相同斜率的直线连起来%%%%%%%%%%%%
- k=1;
- while(k<=length(lines))
- if(k~=length(lines))
- k=k+1;
- end
- while(abs(xielv(k)-xielv(k-1))<0.0001)
- k=k+1;
- if(k>length(lines))
- break;
- end
- end
- if(abs(xielv(k-1))<0.05||abs(xielv(k-1))>=10)%eliminatehorizontalandverticallines,防治水平线和楼房
- st=k;
- if(k~=length(lines))
- continue;
- end
- end
- if(st==length(lines)&&k==st)
- if(abs(xielv(k))>0.05&&abs(xielv(k))<10)
- nlind=nlind+1;
- newlines(nlind)=lines(st);
- newlines(nlind).point2=lines(k).point2;
- newxy=[newlines(nlind).point1;newlines(nlind).point2];
- plot(newxy(:,2),newxy(:,1),'LineWidth',4,'Color',[.61.0.8]);
- end
- break;
- end
- %end=k-1,start=st;drawline
- nlind=nlind+1;
- newlines(nlind)=lines(st);
- newlines(nlind).point2=lines(k-1).point2;
- newxy=[newlines(nlind).point1;newlines(nlind).point2];
- plot(newxy(:,2),newxy(:,1),'LineWidth',4,'Color',[.61.0.8]);
- st=k;
- end
- fprintf('%dlinesaredetectedinsum.n',nlind);
% 入口图像为 BW,出口图像为f%optimize from main_optimize, merely select 2 lines, one has positive%slope,the other has negative slopeclear all,close allBW=imread('D:ImagesNEWimg4b9faef664e03.jpg');figure,imshow(BW);BW=rgb2gray(BW);%thresh=[0.01,0.17];thresh=[0.01,0.10];sigma=2;%定义高斯参数f = edge(double(BW),'canny',thresh,sigma);figure,subplot(121);imshow(f,[]);title('canny Edge Detect Result');[H, theta, rho]= hough(f, 0.1);%cos(theta)*x+sin(theta)*y=rho%imshow(theta,rho,H,[],'notruesize'),axis on,axis normal%xlabel('theta'),ylabel('rho');[r,c]=houghpeaks(H,10);hold onlines=houghlines(f,theta,rho,r,c);subplot(122);imshow(f,[]),title('Hough Transform Detect Result'),hold onnlind=0;%new line indexst=1;%%%%%%%%%求斜率%%%%%%%%%%%%for k=1:length(lines) %xy=[lines(k).point1;lines(k).point2]; xielv(k)=(lines(k).point2(1)-lines(k).point1(1))/(lines(k).point2(2)-lines(k).point1(2)+0.0001)end%%%%%%%%%将相同斜率的直线连起来%%%%%%%%%%%%k=1;while(k<=length(lines)) if(k~=length(lines)) k=k+1; end while(abs(xielv(k)-xielv(k-1))<0.0001) k=k+1; if(k>length(lines)) break; end end if(abs(xielv(k-1))<0.05||abs(xielv(k-1))>=10)%eliminate horizontal and vertical lines,防治水平线和楼房 st=k; if(k~=length(lines)) continue; end end if(st==length(lines)&&k==st) if(abs(xielv(k))>0.05&&abs(xielv(k))<10) nlind=nlind+1; newlines(nlind)=lines(st); newlines(nlind).point2=lines(k).point2; newxy=[newlines(nlind).point1;newlines(nlind).point2]; plot(newxy(:,2),newxy(:,1),'LineWidth',4,'Color',[.6 1.0 .8]); end break; end %end=k-1,start=st; draw line nlind=nlind+1; newlines(nlind)=lines(st); newlines(nlind).point2=lines(k-1).point2; newxy=[newlines(nlind).point1;newlines(nlind).point2]; plot(newxy(:,2),newxy(:,1),'LineWidth',4,'Color',[.6 1.0 .8]); st=k;endfprintf('%d lines are detected in sum.n',nlind);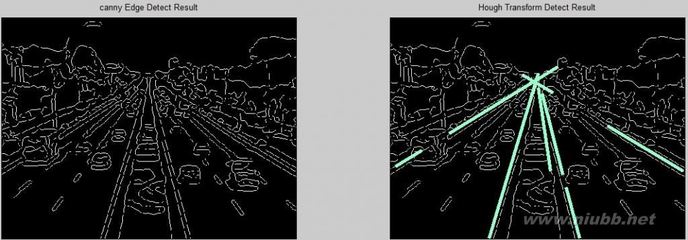
实验结果:
原图:
未优化的霍夫变换:
优化后:
转自 : http://blog.csdn.net/abcjennifer/article/details/6674572
************************************另一版本******************************
总结如下:
(1)对图片预处理,这里必须说明的是,纯种的Hough变换只适应黑白图片,换句话说,在使用它之前,你已经提取出该图片的边缘了。
(2) 找到图片中的“黑点”也就是要处理的边缘,假设其在直角坐标系的下标为(x,y),对其进行坐标变换ρ=x*cosθ+y*sinθ,其中0<θ<2*pi。当然,在实际的操作中,θ要转变为离散的数组θ1、θ2……θj,ρ也就是相应的有ρ1、ρ2……ρj。
(3) 判断(ρj, θj)与哪个数组元素对应,并让该数组元素加1。
(4) 比较数组元素值的大小,最大值对应的(ρj, θj)就是这些共线点对应的直线方程的参数。共线方程为
ρj = xcosθj + ysinθj
在matlab中,使用hough、houghpeaks和houghlines可以简单的检测到直线。例子如下。
I = imread('test12.bmp');%读入示例图片%
Imshow(I);%显示示例图片%
Img =edge(I,'prewitt');%利用prewitt算子提取边缘%
Imshow(Img);%显示提取边缘的图片%
[H, T, R] =hough(Img);%hough变换%
imshow(sqrt(H),[]);%hough变换的结果%
P = houghpeaks(H, 15, 'threshold', ceil(0.3*max(H(:))));
%寻找最大点%
lines = houghlines(Img, T, R, P,'FillGap',10,'MinLength',20);
%返回找到的直线%
figure, imshow(I), hold on
max_len = 0;
for k = 1:length(lines)
xy = [lines(k).point1; lines(k).point2];
plot(xy(:,1),xy(:,2),'LineWidth',2,'Color','green');
plot(xy(1,1),xy(1,2),'x','LineWidth',2,'Color','yellow');
plot(xy(2,1),xy(2,2),'x','LineWidth',2,'Color','red');
end