http://www.yantan.cc/blog/?action-viewthread-tid-92327
咖啡杯水仙 发表于: 2009-7-04 16:28 来源:燕谈博客
[i=s] 本帖最后由 咖啡杯水仙 于 2009-7-4 16:34 编辑
Global Money Supply and the Value of Gold
by Dollardaze aka Mike Hewitt with Krassimir Petrov, PhD.| January 26, 2009
全球货币供应与黄金价值
Dollardaze aka Mike Hewitt与Krassimir Petrov博士 2009年1月26日
Introduction
序言
In this essay we attempt to estimate global money supply and relate it to global supply of gold. For the global money supply, we use money supply figures for currency in circulation from 86 selected currencies, from 81 independent countries and five monetary unions. For the global supply of gold, we use data from theWorld Gold Council(WGC). Finally, we attempt to interpret the price of gold as a relationship between global money supply and global gold supply.
在本文中,我们试图通过厘清全球货币供应情况并将其对应于黄金供应。在全球货币供应方面,我们的货币供应模型选取了86种主要货币的流通量,它们分别来自81个独立的主权国家和5个货币联盟。在全球黄金供应情况上,我们使用了世界黄金协会(World Gold Council,WGC)的数据。最终,我们试图解释金价的生成与全球货币及黄金供应的关系。
Data Description
数据描述
For money supply, we consider five monetary unions and 81 sovereign (independent) currencies. Here is a quick survey of those unions. The first monetary union is the European Monetary Union (EMU), commonly known as the Eurozone, and using the Euro as a common currency. It includes 16 Western European countries, such as Germany, France, Belgium, and Austria. The second currency union is the East Caribbean Currency Union, which uses the East Caribbean Dollar, and includes members like Antigua and Barbuda. The third union is the West African Monetary Union (UEOMA), using the West African Franc, and includes members like Benin and Burkina Faso. The fourth union is the Central African Monetary Union, technically known as CEMAC, which uses the central African Franc, and includes members like Cameroon, Chad, and Congo. The fifth union is technically known as the IEOM, uses the French Pacific Franc, and includes members like French Polynesia and New Caledonia.
在货币供应上,我们对5个货币联盟和81个主权国家进行了观察。这些货币联盟主要有,一、欧洲货币联盟(European Monetary Union,EMU),亦被广泛地称作欧元区,使用欧元为主要通货。欧元区包括16个西欧国家,例如德国、法国、比利时和奥地利等。二、东加勒比海货币联盟(East Caribbean Currency Union ECCU),在该地区,人们使用东加勒比海元,这一联盟包括了安提瓜和巴布达。三、西非货币联盟(West African Monetary Union,UEOMA),使用西非法郎,其成员有贝宁和布基纳法索等。四、中非货币联盟(Central African Monetary Union,CEMAC),被缩写成CEMAC,使用中非法郎,该盟包括喀麦隆、乍得和刚果等国。五、这一货币联盟被称作IEOM,使用法属太平洋法郎,成员包括法属波利尼西亚群岛和新喀里多尼亚(位于东经165度,南纬21.5度。1853年以来一直为法国海外领地。)
最新回复
咖啡杯水仙 at 2009-7-04 16:29:31
Table 1 below,Currency Unions, provides the details for each currency union, such as its popular and technical name, its currency name, currency code, and member countries.
(下表一:货币联盟,提供了每个货币联盟的具体细节,如普遍称谓和专业称谓,通货名称、代码及成员国)
Table 1. Currency Unions
Monetary Union
Currency Name
Code
Countries
Eurozone
欧洲区
Euro
欧元
EUR
Austria, Belgium, Cyprus, Finland, France, Germany, Greece, Ireland, Italy, Luxembourg, Malta, Netherlands, Portugal, Slovakia, Slovenia, Spain
East Caribbean Currency Union
东加勒比海货币联盟
East Caribbean Dollar
东加勒比海元
XCD
Anguilla, Antigua & Barbuda, Dominica, Grenada, Montserrat, Saint Kitts & Nevis, Saint Lucia, Saint Vincent & the Grenadines.
UEMOA (Union Économique et Monétaire Ouest Africaine, or “West African Economic and Monetary Union”)
西非经济与货币联盟
CFA franc BCEAO (West African Franc)
西非法郎
XOF
Benin, Burkina Faso, Côte d'Ivoire, Guinea-Bissau, Mali, Niger, Senegal, and Togo
CEMAC (Communauté Économique et Monétaire de l'Afrique Centrale, or “Economic and Monetary Community of Central Africa”)
中非经济与货币合作组织
CFA franc BEAC (Central African Franc)
中非法郎
XAF
Cameroon, Central African Republic, Chad, Republic of the Congo, Equatorial Guinea and Gabon
IEOM (Institut d'Émission d'Outre-Mer, or “Overseas Issuing Institute”)
大洋发行协会
CFP franc (French Pacific Franc)
法属太平洋法律
XPF
French Polynesia, New Caledonia, and Wallis & Futuna
The five currency unions and 81 independent currencies cover a total of 122 countries that make up98.4% of the world's GDPand86.1% of the world's population. Figure 1 below visualizes the coverage. Areas with grey color on the map represent countries without available data. Areas with blue, red, and orange color represent the three most important economic unions, respectively the European, the West African, and the Central African Unions.
文中所述及的五个货币联盟和81个独立国家涵盖了全球122个国家,占全球GDP的98.4%,和总人口的86.1%。图1标明了本次分析的涵盖面。地图上的灰色区域为未被覆盖的国家。蓝色、红色和橙色区域为三个最重要的经济联盟,分别对应欧洲、西非和中非联盟。
咖啡杯水仙 at 2009-7-04 16:30:07
Figure 1. Countries Included in the Analysis.
图1:本次分析所涵盖的国家
Reliable money supply data could not be found for all countries. The five largest economies for which data was unavailable were: Morocco, Vietnam, Angola, Sudan, and Cuba. These countries comprise 0.6% of world GDP and 2.8% of world population. Their relatively insignificant share of the global economy makes us believe that their exclusion from our analysis would not materially affect our results and our conclusions.
并非所有国家都能够找到可靠的货币供应数据。在这些国家里,最大的5个经济体为:摩洛哥、越南、安哥拉、苏丹有古巴。这些国家拥有全世界0.6%的GDP和2.8%的人口。它们对于全球经济的无关紧要性使我们认为,它们的缺失并不会有形地影响到我们分析的结果及作出的结论。
Myanmar (Burma) requires a special note. Cross-country money supply comparisons rank Myanmar very high. This apparent paradox arises from the discrepancy between the overvalued official exchange rate and the more realistic “black market” exchange rate. For the local currency, the 2005 money supply is reported at 1.83 trillion kyat (MMK). The official exchange rate (6.7147 MMK to 1 USD) makes this the fifth most valuable currency in the world with a value of US$273 billion. The unofficial black market exchange rate (1300 MMK to 1 USD) provides a value of only US$1.4 billion. In our opinion, the official rate overvalues the currency roughly 200 times and introduces an obvious bias in the data, so Myanmar money supply was not included.
值得一提的是缅甸。通过跨国货币供应比照,该国的货币供应量应该是非常高的。这一显著的矛盾体现在过高的官价汇率和“黑市”汇率的巨大差异上。就当地货币供应而言,2005年这一数字据报道是1.83万亿缅元(kyat,MMK)。从官价汇率(6.7147缅元兑1美元)上看,这是世界上第五大值钱的货币,其年供应量对应的是2730亿美元。然而用非官方的黑市汇率(1300缅元兑1美元)来形容的话,这一供应量却只相当于14亿美元。就我看来,缅元的官方汇率高估了整整200倍,并导致了数据上的明显偏离,因此缅元的供应量不能包括在本次分析之内。
Monetary Aggregates
货币流通额
The Bank of International Settlements (BIS) provides a link on their website that lists central banks for different countries. The following charts and tables use money supply data from these official websites, whereby each link identifies the economic area
国际开发银行(BIS)在他们的网站上提供了导向不同国家央行的链接。下列图表所用的数据都是来源于这些官方网站,因此每条链接都指向相关的经济区。
Unfortunately, there is no unified methodology for calculating different monetary aggregates. This presents analytical problems as different countries use different definitions of money supply. Different definitions, in turn, require different methodologies for calculating different monetary aggregates, which immensely complicates cross-country comparisons. Unfortunately, we are not aware of any widely accepted solution to this particular problem.
不幸的是,并没有统一的方法论去计算不同的货币流通额。这就为分析不同国家使用不同货币供应定义方式带来了麻烦。不同的定义方式,要求使用不同的方法来计算不同国家的货币流通额,这就使整个跨国货币供应分析被极大地复杂化了。可惜的是,对这个特殊的问题,我们现在还没有广泛认可的解决方法。
Quite commonly, money is conceptually defined across a continuum from narrow money to broad money. Narrow money typically includes highly liquid forms of money that serve the function of medium of exchange, while broad money additionally includes other less liquid forms of money that serve the function of store of value. Monetary aggregates are conventionally denoted in ascending order by M0, M1, M2, M3, etc. Smaller aggregates like M0 and M1 correspond conceptually to narrow money supply, while larger aggregates like M2 and M3 correspond to broad money supply. We should note that in the heady days of monetarism, economists have further elaborated those aggregates and have devised M4, M5, M6, etc.
非常普遍的是,货币被概念地定义为一个从狭义到广义的封闭集合。狭义货币典型地包括了货币的高流动性形式,服务于交换功能的中间物,同时,广义货币则在狭义货币的基础上再添加了其他一些流动性不那么强的形式:例如执行价值储备的功能。货币流通额按惯例被表示为逐级递升的M0、M1、M2、M3等。小集合如M0和M1等同于狭义货币供应,而比较大的集合如M2和M3则等同于广义货币供应。我们应该记住,在货币主义者们倍感振奋的日子里,经济学家把更加广义的货币流通额称为M4、M5、M6等。
Most generally and most commonly, but not necessarily uniformly, M0 refers to outstanding currency (banknotes and coins) in circulation, but excluding cash reserves. M1 includes M0, demand deposits, and cash reserves. M2 includes M1 and savings deposits, conventionally maturing within two years or redeemable at notice within three months. M3 includes M2, repurchase agreements, money market funds, and debt securities maturing within two years.
从最平常和最普遍而不必要硬要一致的角度而言,M0就是流通中的基本通货(如支票和硬币),但排除现金储备。M1包含量M0,还有活期存款和现金储备。M2包括了M1和储蓄存款,常常是两年内或三月内可即时赎回的。M3包括了M2,重购协议、货币市场基金以及两年期内债务证券。
Additionally, not every country publishes all four of the common monetary aggregates. For example, the U.S. Federal Reserve ceased publishing M3 on May 23, 2006. However, various independent sources have successfully reconstructed the M3 series and have continued to publish it.
For our analysis, we concentrated exclusively on the narrowest measure of money supply, M0. Conceptually, it corresponds best to the monetary interpretation of gold. We expect it to relate well to the value of gold, although further studies may be necessary to analyze the relationship of gold to higher aggregates, such as M1, M2, and M3.
此外,并非每个国家都以这四种定义来衡量货币流通额。例如,美联储在2006年5月23日以后就不再公布M3。然而,各种独立信息来源仍然成功地重组了M3供应量的情况,并继续公之于众。
对于我们的分析来说,我们仅将视线集中在最狭义的货币供应——M0上。在概念上,这最符合货币供应对黄金价格的影响。我们希望它能很好地与黄金价格联系,尽管在进一步的研究中也许会通过更高级的货币流通额如M1、M2和M3来衡量它们对黄金价格的影响。
咖啡杯水仙 at 2009-7-04 16:31:02
Global Currency Comparisons
全球货币对比
The following pie charts on Figure 2 below show the relative value of global currencies (M0) when converted to USD for means of comparison.
接下来的饼形图(图2)展示了全球M0以美元价格为衡量的构成情况。
Figure 2. Global Narrow Money Supply
图2:全球狭义货币供应
The left-hand side of the figure shows that the four largest currencies in circulation comprise nearly three-quarters of the global narrow money supply. Not surprisingly, those currencies are the Euro, the Dollar, the Yen, and the Yuan. The right-hand side zooms in on the “other” 79 currencies of the left-hand side that were simply too small to see when shown together with the big currencies. We show then next thirteen most important currencies that comprise in value more than half of the “other” category. It is clear from the picture that those thirteen currencies are really small relative to the big currencies. Nevertheless, it illustrates well their relative size in the global money supply.
图左为四种流通量最大的货币,它们占了全球狭义货币供应量近3/4的比例。毫不奇怪,这些货币是欧元、美元、日元和人民币。图右是图左“其他”(others)的放大版,包括了其他79种货币的发行情况。这些货币和几种主要货币来比的话,发行量太少,以致不能在图左得到清晰地显示。我们在图右中又列出了其他13种最重要的货币,它们又在“其他”中占去了一半多的比例。我们可以清楚地看到,那十三种货币和主要货币来讲,占有的比例是多么微乎其微。尽管如此,这还是很好地显示了全球货币供应中各种货币所占的比例。
Next, we consider narrow money supply growth rates. For the whole dataset, the average growth rate of M0 is 8.2%. Table 2 below shows the twelve currencies with the fastest annual growth rates of M0, shown in the middle column highlighted in yellow:
然后我们将货币供应增量考虑在内。对于整个数据系统而言,M0的平均增长率是8.2%。表2显示的是12种年增长率最快的狭义货币(M0),它们的增长率被放在表格中央纵列内,并被涂黄以标明。
Table 2: Fastest Growing Currencies in Relative Terms
表2:相对期限内发行量增长最快的的货币
RANK
排名
COUNTRY
国家
CURRENCY CODE
货币代码
Y-O-Y INCREASE IN M0年M0增长率
EXCHANGE RATE
(OCT 31, 2008)
兑美元汇率(2008-10-31)
BILLIONS
单位(十亿元)
%
US$ BILLIONS
以美元衡量
(单位:十亿)
1
Zimbabwe
津巴布韦
ZWD
> 900,000,000
> 2 x 10¹⁶%
0.02
*
2
Azerbaijan
阿塞拜疆
AZN
1.49
69.7%
1.85
1.235330
3
Ukraine
乌克兰
UAH
47.28
47.8%
7.16
0.151403
4
UAE
阿拉伯联合酋长国
AED
10.67
44.1%
2.90
0.272000
5
Estonia
爱沙尼亚
EEK
12.86
42.3%
1.07
0.083263
6
Indonesia
印度尼西亚
IDR
62,839.00
39.2%
6.31
0.000100
7
Bangladesh
孟加拉国
BDT
109.66
39.0%
1.59
0.014468
8
Belorussia
白俄罗斯
BYR
1,100.70
35.0%
0.52
0.000473
9
Zambia
赞比亚
ZMK
404.39
33.2%
0.09
0.000211
10
Nigeria
尼日利亚
NGN
171.81
30.1%
1.45
0.008423
11
Venezuela
委内瑞拉
VEF
3.56
29.5%
1.66
0.465700
12
Iran
伊朗
IRR
15,874.70
29.3%
1.58
0.000099
*The Reserve Bank of Zimbabwe ceased publishing any statistics after June 2008 at which point 1 USD equalled 40.9 billion Zimbabwe dollars.
*津巴布韦储备银行在2008年6月后停止宣布货币发行量的统计数据,其时,1美元可换409亿津巴布韦元。
It is clear from the above table that while their growth rates are relatively high, they are also relatively small in absolute terms, and subsequently relatively insignificant.
从上表清晰可见,尽管这些国家的货币增长率相对来讲非常地高,但是从绝对期限上看,它们的货币发行规模还是相对较小的,而且也是落后和相对无足轻重的。
On the other hand, when converted to US dollars as of Oct 31, 2008, the fastest growing currencies in absolute terms are shown in Table 3 below.
在另一方面,以2008年10月31日汇率兑换成美元来看,表3显示了在绝对期限内发行量增长最快的货币。
Table 3: Fastest Growing Currencies in Absolute Terms
表3:绝对期限内增长最快的货币
RANK
排名
COUNTRY
国家
CURRENCY CODE
货币代码
Y-O-Y INCREASE IN M0年M0增长率
EXCHANGE RATE
(OCT 31, 2008)
兑美元汇率(2008-10-31)
BILLIONS
单位(十亿元)
%
US$ BILLIONS
以美元衡量(单位:十亿元)
1
EU
欧盟
EUR
81.20
13.2%
107.59
1.324990
2
China
中国
CNY
298.22
10.5%
43.61
0.146224
3
US
美国
USD
34.20
4.50%
34.20
1.000000
4
Russia
俄罗斯
RUB
683.30
21.2%
25.79
0.037738
5
India
印度
INR
1,050.63
20.8%
21.66
0.020617
6
Poland
波兰
PLN
30.29
30.9%
11.22
0.370290
7
Japan
日本
JPY
811.60
1.13%
8.11
0.009995
8
Brazil
巴西
BRL
16.48
25.1%
7.57
0.459330
9
Ukraine
乌克兰
UAH
47.28
47.8%
7.16
0.151403
10
Indonesia
印度尼西亚
IDR
62,839
39.2%
6.31
0.000100
11
UK
英国
GBP
2.85
4.50%
4.80
1.683800
12
Switzerland
瑞士
CHF
5.43
13.0%
4.75
0.874520
From the comparison of the above two tables, it is quite obvious that the rapidly inflating currencies are relatively small to affect global money supply growth rates. From the second table it is clear that the “big” currencies contribute the bulk of increases in the global money supply. From this particular analysis we can conclude that a sample of the biggest 10-15 currencies in the world can provide a meaningful approximation of the growth rate of global money supply.
从上面两张表的比较中,我们可以非常明显地发现,通货膨胀较快的货币影响全球货币供应增长率较小。第二张表里清晰地显示出,“大”货币贡献了全球货币供应的容积增量。从这个特殊的分析中,我们可以推断,以全世界最大的10~15种货币的供应情况为样本,便能为全球货币供应量的估算提供一种有意义的参考。
咖啡杯水仙 at 2009-7-04 16:32:50
[i=s] 本帖最后由 咖啡杯水仙 于 2009-7-4 16:39 编辑
Money Supply vs. Gold Supply
货币供应与黄金供应
It is estimated by the WGC that a total of 165,547 tonnes of gold have been mined. This is equivalent to about 5.32 billion ounces. Most of that gold is currently available as supply at some price, possibly much higher than the current market price. Given that the total gold supply is relatively stable and that very little gold is consumed in industrial processes, the annual increase in the supply of gold from current mining is relatively stable -- about 1.5%.
据世界黄金协会估计,全球已开采黄金(地表存金)大约有16.5547万吨,相当于53.2亿盎司。大部分黄金作为有效供应正在某些价位等待出售,这些价位很可能大大高于现在的市场价格。总的黄金供应量是相对稳定的,只有少数黄金工业中被消耗掉,由地下开采上来的黄金供应量也是相对稳定的,大约为年均1.5%(也就是说,地表存金量年均增加1.5%——译者)。
Figure 3 below shows the calculation of the value of all gold ever mined. The top left graph in the figure shows the price of gold for the period of 1970-2008. The top right graph in the figure shows the quantity of all gold mined for the same period. Finally, the bottom graph in the figure shows the product of the price with the quantity, which represents the value of all gold ever mined.
下面的图3显示了所有黄金价值的计算过程。图3中,左上角的小图显示了1970~2008年的金价变化,右上角的小图显示了同一时期所有开采黄金(地表存金)的数量。最后,底部小图显示了黄金价格与数理的乘积变化,即所有黄金的价值变化情况。
For example, the 10-31-2008 closing spot price for one troy ounce of gold was US$806.62. Multiplied by the corresponding quantity, the total value of all gold ever mined was US$4.3 trillion. This is just slightly more than the $4.03 billion global M0 money supply from Figure 2 above.
例如,在2008年10月31日的黄金价格为每金制盎司(31.1035克)806.62美元,这个价格乘以对应的数量,黄金总价则为4.3万亿美元。这只是些微高于在上面表2中显示的4.03万亿美元的全球狭义货币供应量。
Figure 3. Global Value of Gold
黄金价值.JPG
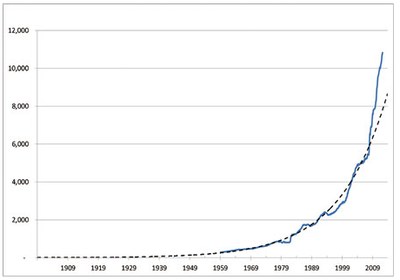
Figure 4 below shows a historical comparison for the value of mined gold against that of currency in circulation. This chart essentially overlays our previous data on global money supply with the data on the value of gold. It provides the basis for our valuation of gold.
下列表4将历史的黄金价值总量与流通中货币进行了比较。这份行情图明显压倒了我们以前关于全球货币供应与黄金价格数据的比照。它为我们提供了黄金价格的基础。
Figure 4. Global Money Supply vs. Global Value of Gold
Gold Valuation
黄金价格
The period from 1945 to 1971 is widely known as the “Bretton Woods” era. The chief aim of the Bretton Woods Agreements was to establish the rules for commercial and financial relations among the world's major industrial states. The policy required that each country maintained the exchange rate of its currency within a fixed value—plus or minus one percent – to the U.S. dollar, which in turn would be convertible to gold at the rate of US$35/oz for foreign governments.
The system collapsed when President Nixon took the US dollar off the gold standard on Aug 15, 1971 in response to growing demands from foreign governments to exchange their paper dollars for US Treasury gold. At that time there was some speculation by professional economists and Wall Street that the price of gold would collapse as the US dollar ‘would no longer hold it up’. In reality, just the opposite occurred – not only did gold not collapse, but instead it began a multi-year bull market, reaching an intraday peak of US$873 a troy pounce on January 21, 1980.
在1945~1971年这段时间里,被广泛地称作“布雷顿森林体系”时代。布雷顿森林协议的主要目标是建立与世界上主要工业国家间通用的商业和金融规则。这一政策,要求每个国家都应在一种混合的价值体系内——上下百分之一的幅度里,对美元保持本币汇率的稳定,而美元以35美元一盎司的价格向外国政府敞开黄金兑换窗口。这一体系在1971年8月15日崩溃,其时,尼克松总统关闭了黄金窗口以回应外国政府日益增长的以美元换黄金的要求。从那时起,就有专业的经济学家和华尔街人士以“美元不再坚挺,黄金也将崩溃”为由从事一些黄金的投机买卖活动。事实上,只有相反的情况发生了,黄金价格不但没有崩溃,反而开始了一轮持续多年的牛市,在1980年1月21日达到了873美元一金制盎司的巅峰价格。
Our analysis essentially begins approximately with the collapse of Bretton Woods. The first major observation is that during the 1970s, gold advanced much farther than money supply. There are two fundamentally different explanations for this phenomenon. The first explanation, espoused by neoclassical economists, is that gold is inherently more volatile and more unstable than paper currencies. The other explanation, espoused by Austrian economists, is that gold is inherently stable and that paper currencies are inherently unstable, so that the high volatility of gold reflects the discounted value of expected future inflation. In other words, Austrians contend that the monetary policy associated with paper currencies is inherently unstable, and this instability of paper currencies is magnified when discounted to the current price of gold; this discounting mechanism generates the apparent excessive volatility of gold.
我们的分析本来开始于布雷顿森林体系崩溃大约崩溃的时候。第一个基础性的观察期约在1970年代中(原文如此——译者),黄金价格推进得大大快于货币的供应。关于这种现象,有两种截然不同的解释。第一种解为某些新古典主义的经济学家们所信奉,他们认为黄金价值是本来就比纸币价值更具波动性,更加不稳定。另一种解释认为,黄金天生就比纸币价值稳固,而在这方面纸币天生不如黄金。因此黄金的高波动性反映的是对未来通货膨胀的预期。换言之,奥地利学派争辩道,货币政策和与之相联系的纸币是天然不稳固的,而且这种纸币价值的不稳定性在黄金现货价格面前的贴现时被放大了;这种贴现机理导致了黄金价格过度的波动性。
The second fundamental observation is that during the 1970s, gold rose at significantly faster rates than money supply. Neoclassicals explain this with the inherently volatile nature of gold. However, volatility simply cannot explain this 10-year trend. Volatility relates to variability in prices around the trend, not to the direction of the trend. Neoclassical economists have no meaningful explanation here, except to resort to volatility of gold and irrational behaviour of gold “investors”. On the other hand, the explanation by Austrians is straightforward and logical, as inflation accelerated throughout the 1970s, the discounting mechanism of the gold market resulted in accelerating price of gold from the rising inflationary expectations.
第二个基础性观察期是在1970年代中,黄金价格的提升速度显著快于货币供应量。新古典主义者们将这种情况解释为金价天生的波动性。然而,波动性并不能简单地解释这10年的趋势。波动性与黄金价格的易变性在这一趋势周围联系,而非与这一趋势的方向相联系。在这方面,新古典主义经济学家并无有意义的结论,除了诉诸于黄金价格的波动性和黄金“投资者”的非理性行为。而另一方面,奥地利学派的解释则是简单明了并富于逻辑性的:由于通货膨胀在1970年代不断累积,因此黄金市场的贴现机理导致了金价在不断抬升的通胀预期里叠创新高。
The third fundamental observation is that there is a possibility for a long-term divergence between the value/price of gold and global money supply. This divergence is obvious for the period of 1980-2000. The neoclassical school has not offered a satisfactory explanation of this phenomenon except to point out disparagingly that gold is a “barbarous relic”, “irrelevant” or “dead”. The Austrian explanation, however, is again quite straightforward: the period was generally characterized by disinflation, so the discounting mechanism produced lower gold prices due to the falling inflationary expectations that more than offset increases in money supply.
第三个基础性观察期是在一个黄金价格和全球货币供应量可能出现了长期背离的时侯。这一背离显然是1980~2000年间。新古典主义学院派们并未就此现象提出令人满意的解释,除了以轻蔑的态度指出黄金是一种“野蛮的遗迹”、“过时的”或者“死亡的”。然而,奥地利学派则又一次非常直截了当地指出,这一时期总体上被通货紧缩所笼罩,因此贴现机理在日渐下落的通货膨胀预期下造成了日益低落的金价,这一机理的影响,抵消了日益增长的货币供应。
Conclusion
结论
This analysis leads us to speculate that while divergences caused by inflationary expectations can last for a very long time, even decades, the long-term price of gold is driven by global money supply.
这一分析,引起我们的深思:由通胀预期引发的背离可以持续相当长的时间,甚至数十年之久,然而,黄金的长期价格仍然由全球货币供应量所控制。
Resources:
资源:
As an interesting aside, one may note that the present US debt of US$10.5 trillion easily exceeds the value of ALL circulating currencies in the world PLUS the value of all gold ever mined! A naive person may wonder just exactly how the American government ever intends to pay this debt off...
作为一首有趣的插曲,我们可能都会注意到美国现有的债务额为10.5万亿美元,它们非常轻易就超越了全世界所有已开采的黄金价值总和。一个幼稚的人可能想确切地知道美国政府会打算如何偿清这些债务。
It was illegal for Americans to own gold for investment purposes since President Roosevelt signed Executive Order 6102 on April 5, 1933. It wasn’t until Dec 31, 1974 when Americans could own once again own gold coins, bars and certificates.
在1933年8月5日美国总统罗斯福签署了第6102号总统令后,美国人以投资为目的去拥有黄金就成了非法行为,直到1974年12月31日,美国人才得以重新拥有金币、金条和证书。
In nominal terms, gold did not surpass this level until Jan 8, 2008 – nearly some 28 years later.
在名义价格上,黄金并没有超过前期高点(850美元/盎司)直到2008年1月8日,差不多28年以后。