2013.10.21
美国航空航天局史匹哲太空望远镜(Spitzer Space Telescope)拍摄的银河系中心图像
华盛顿——美国航空航天局(NASA)及其几十个使命项目每天传回的数据犹如奔涌的河流。航天器监测从我们的地球家园到遥远星系的一切,将图像和信息传回地球。所有这些数码记录都需要储存、索引和处理,以便世界各地的工程师、科学家和其他人员可以使用这些数据来理解地球及其以外的宇宙。
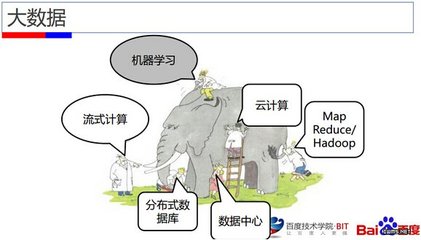
使命项目策划者和软件工程师正在寻找管理如此庞大复杂而且不断增大的数据流的新策略,这样的数据流在信息技术行业中被称为“大数据”(Big Data)。
“大数据”有多大?美国航空航天局的各项使命每小时收集数百TB数据。仅1TB就相当于在50,000棵树制成的纸张上打印的信息。
位于加利福尼亚州帕萨迪纳(Pasadena)的美国航空航天局喷气推进实验室(Jet PropulsionLaboratory)的美国航空航天局太阳系可视化项目(Solar System Visualizationproject)的负责人埃里克·德容(Eric DeJong)说:“科学家们将大数据用于各种目的,从预测地球的天气到监测火星上的冰盖再到搜索遥远的星系。我们是数据的保存者,而数据使用者则是需要图像、拼图、地图和影片来寻找模式并验证理论的天文学家和科学家。”太阳系可视化项目可将美国航空航天局使命项目的科学成果转化为研究人员可以使用的可视化产品。
德容解释说,应对来自太空使命的数据涉及三个方面:储存、处理和访问。第一项任务——储存或存档数据,对于更大量的数据来说自然更具挑战性。平方千米阵(SquareKilometerArray)是计划部署在南非和澳大利亚的由数千个望远镜组成的阵列,预计每天产生700TB图像数据,相当于因特网每两天的所有数据流量。工程师们正忙于开发更好地储存信息的创新软件工具,而不是创造更多硬件。
美国航空航天局“大数据”计划的一位项目负责人克里斯·马特曼恩(ChrisMattmann)说:“我们不必做无谓的重复劳动。”美国航空航天局一直在加大对开源软件(Open-sourceSoftware)的整合,为太空使命提供经改进的数据处理工具。而后,美国航空航天局的这些工具可供世界其他人用于不同的应用领域。
德容和他的团队正在开发信息可视化的新方式。例如,美国航空航天局火星勘测轨道飞行器(Mars ReconnaissanceOrbiter)上一个摄像机拍摄的每个图像含有120兆像素。除了制作电脑图像和动画使科学家和公众能够近距离了解这颗红色星球,他的团队还用这类数据来制作影片。
德容说:“数据不只是越来越大,而且越来越复杂。我们在不断努力寻找使创建可视化产品过程自动化的方式,以便于科学家和工程师使用这些数据。”
“大数据”领域另一项重要的工作是使用户容易从数据存档中获取所需信息。
美国航空航天局红外处理和分析中心(Infrared Processing and AnalysisCenter)负责人史蒂夫·格鲁姆(SteveGroom)说:“如果你有一个巨型书架,你仍必须知道如何找到需要的书籍。”有时候用户希望一次访问所有数据,以寻找全局模式,这是“大数据”存档的一个好处。格鲁姆说:“天文学家还可以同时浏览我们库存的所有‘书籍’,这在他们自己的电脑上是无法做到的。”
美国航空航天局说,最终,“大数据”潮流将继续猛增,美国航空航天局将开发出新的策略来管理数据流以惠及全球。
Read more: http://iipdigital.usembassy.gov/st/chinese/article/2013/10/20131021284946.html#ixzz2ibXtiPC3
NASA Manages Deluge of “Big Data” for Global Benefit
18 October2013
The center of the Milky Way galaxy as imaged byNASA's Spitzer Space Telescope.
Washington — For NASA and its dozens of missions, data pour inevery day like rushing rivers. Spacecraft monitor everything fromour home planet to faraway galaxies, beaming images and informationto Earth. All those digital records need to be stored, indexed andprocessed so engineers, scientists and people across the globe canuse the data to understand Earth and the universe beyond.
Mission planners and software engineers are coming up with newstrategies for managing the ever-increasing flow of such large andcomplex data streams, referred to in the information technologycommunity as “big data.”
How big is big data? For NASA missions, hundreds of terabytesare gathered every hour. Just one terabyte is equivalent to theinformation printed on 50,000 trees worth of paper.
“Scientists use big data for everything from predicting weatheron Earth to monitoring ice caps on Mars to searching for distantgalaxies,” said Eric De Jong of NASA’s Jet Propulsion Laboratory inPasadena, California, principal investigator for NASA’s SolarSystem Visualization project, which converts NASA mission scienceinto visualization products that researchers can use. “We are thekeepers of the data, and the users are the astronomers andscientists who need images, mosaics, maps and movies to findpatterns and verify theories.”
De Jong explains that there are three aspects to wrangling datafrom space missions: storage, processing and access. The firsttask, to store or archive the data, is naturally more challengingfor larger volumes of data. The Square Kilometer Array, a plannedarray of thousands of telescopes in South Africa and Australia, isexpected to produce 700 terabytes of images every day, equivalentto all the data flowing on the Internet every two days. Rather thanbuild more hardware, engineers are busy developing creativesoftware tools to better store the information.
“We don’t need to reinvent the wheel,” said Chris Mattmann, aprincipal investigator for NASA’s big-data initiative. NASA hasbeen increasingly bringing open-source software into its fold,creating improved data processing tools for space missions. TheNASA tools then go out into the world for others to use fordifferent applications.
De Jong and his team are developing new ways to visualize theinformation. Each image from one of the cameras on NASA’s MarsReconnaissance Orbiter, for example, contains 120 megapixels. Histeam creates movies from data sets like these, in addition tocomputer graphics and animations that enable scientists and thepublic to get up close with the red planet.
“Data are not just getting bigger but more complex,” De Jongsaid. “We are constantly working on ways to automate the process ofcreating visualization products, so that scientists and engineerscan easily use the data.”
Another big job in the field of big data is making it easy forusers to grab what they need from the data archives.
“If you have a giant bookcase of books, you still have to knowhow to find the book you’re looking for,” said Steve Groom, managerof NASA’s Infrared Processing and Analysis Center. Sometimes userswant to access all the data at once to look for global patterns, abenefit of big data archives. “Astronomers can also browse all the‘books’ in our library simultaneously, something that can’t be doneon their own computers,” Groom said.
Ultimately, NASA said, the tide of big data will continue toswell, and NASA will develop new strategies to manage the flow forthe world.
Read more: http://iipdigital.usembassy.gov/st/english/article/2013/10/20131018284886.html#ixzz2ibXzldMn