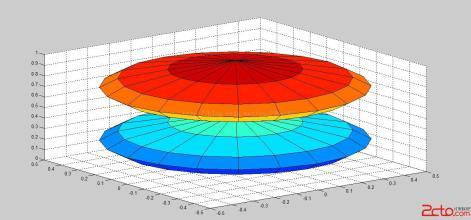
colormap(颜色映射) Set and get the currentcolormap(设置或得到当前的颜色映射表) Syntax(语法) colormap(map) Description(描述) A colormap is an m-by-3 matrix ofreal numbers between 0.0 and 1.0. Each row is an RGB vector thatdefines one color. The kth row of the colormap defines the kthcolor, where map(k,:) = [r(k) g(k) b(k)]) specifies the intensityof red, green, andblue.(一个颜色映射表是一个由0~1的实数组成的m*3矩阵。每一行是一个定义一种颜色的向量。第k行颜色映射表定义了第k种颜色,而map(k,:)= [r(k) g(k) b(k)] 定义了红、绿、蓝的程度) colormap(map) sets the colormap tothe matrix map. If any values in map are outside the interval [01], MATLAB returns the error Colormap must have values in [0,1](colormap(map)把设置颜色映射表设置为矩阵映射。如果映射的任意值超出了0~1的范围,MATLAB就会返回Colormap值必须在0~1之间的错误) colormap('default') sets the currentcolormap to the defaultcolormap.(colormap('default')设置当前颜色映射表为缺省颜色映射表) cmap = colormap; retrieves thecurrent colormap. The values returned are in the interval [01].(cmap = colormap是取回当前的颜色映射表,返回值必须在0~1之间) SpecifyingColormaps(Colormaps的定义) M-files in the color directorygenerate a number of colormaps. Each M-file accepts the colormapsize as an argument. For example,colormap(hsv(128))creates an hsvcolormap with 128 colors. If you do not specify a size, MATLABcreates a colormap the same size as the currentcolormap.(颜色目录的M文件生成一系列颜色映射。每一个M文件把colormap的大小作为一个变量,例如colormap(hsv(128))就是创建了一个带有128种颜色的hsv映射。如果你不定义大小,MATLAB就会创建和当前颜色映射相同的颜色映射) Supported Colormaps(支持的颜色映射) MATLAB supports a number ofcolormaps.(matlab支持一系列颜色映射) autumnvaries smoothly from red,through orange, toyellow.boneisa grayscale colormap with a higher value for the blue component.This colormap is useful for adding an "electronic" look tograyscale images.colorcubecontainsas many regularly spaced colors in RGB colorspace as possible,while attempting to provide more steps of gray, pure red, puregreen, and pure blue.coolconsistsof colors that are shades of cyan and magenta. It varies smoothlyfrom cyan to magenta.coppervariessmoothly from black to brightcopper.flagconsistsof the colors red, white, blue, and black. This colormap completelychanges color with each index increment. gray returns a lineargrayscale colormap.hotvariessmoothly from black through shades of red, orange, and yellow, towhite.hsvvaries the hue component of thehue-saturation-value color model. The colors begin with red, passthrough yellow, green, cyan, blue, magenta, and return to red. Thecolormap is particularly appropriate for displaying periodicfunctions. hsv(m) is the same as hsv2rgb([h ones(m,2)]) where h isthe linear ramp, h =(0:m-1)'/m.jetrangesfrom blue to red, and passes through the colors cyan, yellow, andorange. It is a variation of the hsv colormap. Thejetcolormap is associated with an astrophysical fluid jet simulationfrom the National Center for Supercomputer Applications. See the"Examples" section. lines produces a colormap of colors specifiedby the axes ColorOrder property and a shade ofgray.pinkcontainspastel shades of pink. The pink colormap provides sepia tonecolorization of grayscale photographs. prism repeats the six ————colorsred, orange, yellow, green, blue, and violet. spring consists ofcolors that are shades of magenta andyellow.summerconsistsof colors that are shades of green and yellow. white is an allwhite monochrome colormap. winter consists of colors that areshades of blue and green Examples The images and colormaps demo,imagedemo, provides an introduction to colormaps. Select ColorSpiral from the menu. This uses the pcolor function to display a16-by-16 matrix whose elements vary from 0 to 255 in a rectilinearspiral. The hsv colormap starts with red in the center, then passesthrough yellow, green, cyan, blue, and magenta before returning tored at the outside end of the spiral. Selecting Colormap Menu givesaccess to a number of other colormaps. The rgbplot function plots colormapvalues. Try rgbplot(hsv), rgbplot(gray), and rgbplot(hot). The following commands display theflujet data using the jet colormap. load flujet The demos directory contains a CATscan image of a human spine. To view the image, type the followingcommands: load spine AlgorithmEach figure has its ownColormap property. colormap is an M-file that sets and gets thisproperty. |
matlab中的colormap matlab colormap函数
更多阅读
视频教程:卡尔曼滤波器的原理以及在MATLAB中的实现
视频教程:卡尔曼滤波器的原理以及在MATLAB中的实现。最近一个月的所有周末都用在这上面了,希望大家喜欢。(分享自 @优酷) http://t.cn/RPPT9uz2014-07-14
matlab中如何定义函数 matlab输入函数表达式
matlab中如何定义函数——简介许多时候希望将特定的代码(算法)书写成函数的形式,提高代码的可封装性与重复性,简化代码设计,提高执行效率!下面简单介绍一下matlab中的函数定义与使用。matlab中如何定义函数——工具/原料matlab 7.0及以上
matlab中的最大值和最小值_待_雪 函数最大值和最小值
matlab中的的最大值和最小值MATLAB提供的求数据序列的最大值和最小值的函数分别为max和min,两个函数的调用格式和操作过程类似。1.求向量的最大值和最小值求一个向量X的最大值的函数有两种调用格式,分别是:(1) y=max(X):返回向量X的最
ExternalInterface.addCallback注册的函数在浏览器中的兼容性问题 浏览器兼容性测试
ExternalInterface.addCallback注册的函数在浏览器中的兼容性问题现在做一个小应用,要求使用js调用flash中的函数,就使用了ExternalInterface.addCallback函数。之前用过一次,按照官方API上的方法做了以后,发现只有IE是能正常调用的,其
Excel中Frequency函数的使用 excel frequency函数
Excel电子表格作为办公自动化中重要的一款软件,其强大的数据处理功能中很大一部分取决于函数的使用。本文就函数Frequency的使用做以简单介绍。以一列垂直数组返回某个区域中数据的频率分布。例如,使用函数FREQUENCY 可以计算公司员工