可以使用streamline 函数绘制流线图,如表7.2 所示。
表7.2 streamline 函数
[TR]
[TD][I]498)this.width=498;' onmousewheel = 'javascript:return big(this)' height=187 alt="" src="http://pic.aIhUaU.com/201602/15/2309090.jpg" width=659 border=0>[/TD][/TR]
[TR][/TR](续表)
[TR]
[TD][I]498)this.width=498;' onmousewheel = 'javascript:return big(this)' height=178 alt="" src="http://pic.aIhUaU.com/201602/15/2309091.jpg" width=657 border=0>[/TD][/TR]
[TR][/TR]
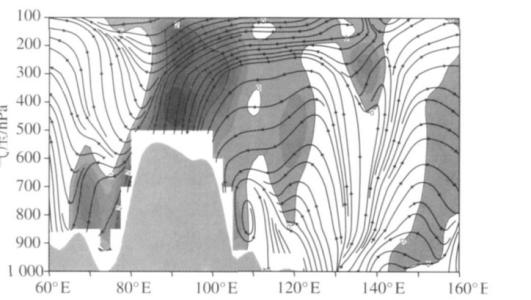
利用MATLAB 内部所带数据集wind 绘制流线图。figure;%生成新图形窗口 colordef(gcf,'white')%图形窗口颜色设置 cla%清理显示空间 loadwind%载入数据 [sxsysz]=meshgrid(80,20:10:50,0:5:15);%数据准备 h=streamline(x,y,z,u,v,w,sx,sy,sz);%绘制流线图 set(h,'Color','black');%设置流线颜色 daspect([111])%设置显示比例 boxon;%加立体边框,像个盒子把三维图形包起来 camprojperspective;%设置透视方式 camva(32);%设置摄像机观察角度 axistight%轴的范围为数据范围 campos([1751085]);%设置摄像机位置 camtarget([105400])%设置摄像机拍摄目标 camlightleft;%设置摄像机灯光位置 lightinggouraud%设置灯光算法
运行结果如图7.12 所示。
[TR]
[TD][I]498)this.width=498;' onmousewheel = 'javascript:return big(this)' height=269 alt="" src="http://pic.aIhUaU.com/201602/15/2309092.jpg" width=356 border=0>[/TD][/TR]
[TR]
[TD]图7.12 流线图[/TD][/TR]